But is it Art?
The Mandelbrot Set
Saturday, March 1, 1980
On June 5th, 1978, a mathematics conference at Stony Brook began at which Robert Brooks and Peter Matelski published an abstract on the subject of Kleinian groups (whatever they are). In their abstract they described a mathematical equation and showed an illustration of the output. This is what their 1978 state-of-the-art computer was able to print out for them. It is unmistakably what would become known as the Mandelbrot Set!
The incredible complexity contained within those inauspicious rows of asterisks is created by this amazingly simple equation:

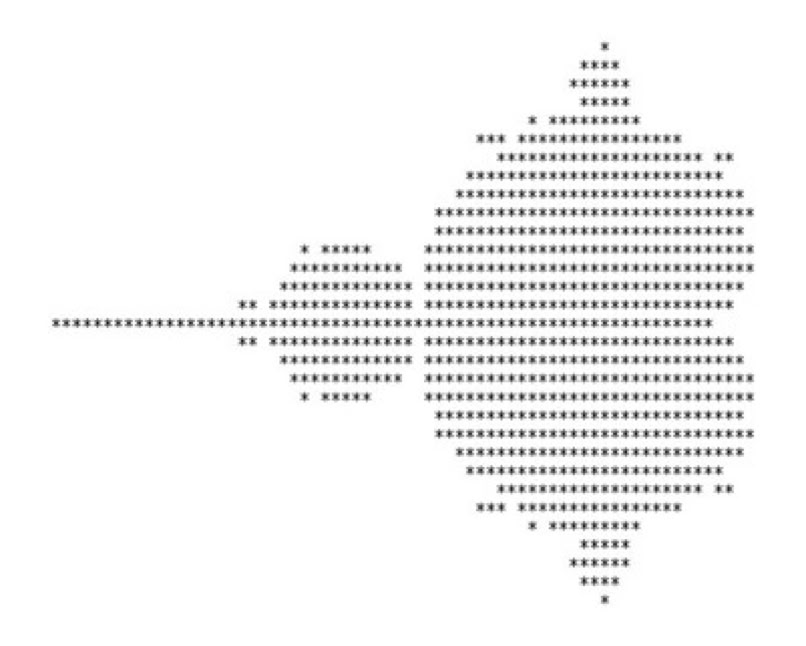
But it would take time and better computers to reveal that complexity.
They did not present at the conference but their abstract was included in the proceedings of the conference; they circulated a pre-print of their article early in 1979, and Brooks presented their findings at Harvard in Spring of 1979. Mandelbrot claimed not to have seen the presentation and their paper was not published until early 1981.
Back in 1976, John Hubbard started working on a method using computers to map out sets of complex numbers using Newton’s method. Frederick Kochman, one of Hubbard’s graduate students, went to a conference in late 1978. He approached Benoit Mandelbrot and showed him some of Hubbard’s work.
Mandelbrot later wrote to Hubbard saying "When sampling the works of Fatou and Julia, I had thought of doing these things myself, but had not mustered the courage. Nevertheless I can claim that I was awaiting your pictures for a long long time."
The inspiration this gave Mandelbrot is undoubtable. Hubbard visited the IBM Thomas J. Watson Research Center where Mandelbrot worked and where they had serious computer power.

Hubbard told Mandelbrot how to program the computer to plot these iterative functions.
Hubbard admitted to not understanding the importance of what he had found. Brooks and Matelski also did not appreciate the significance of this mathematical phenomenon.
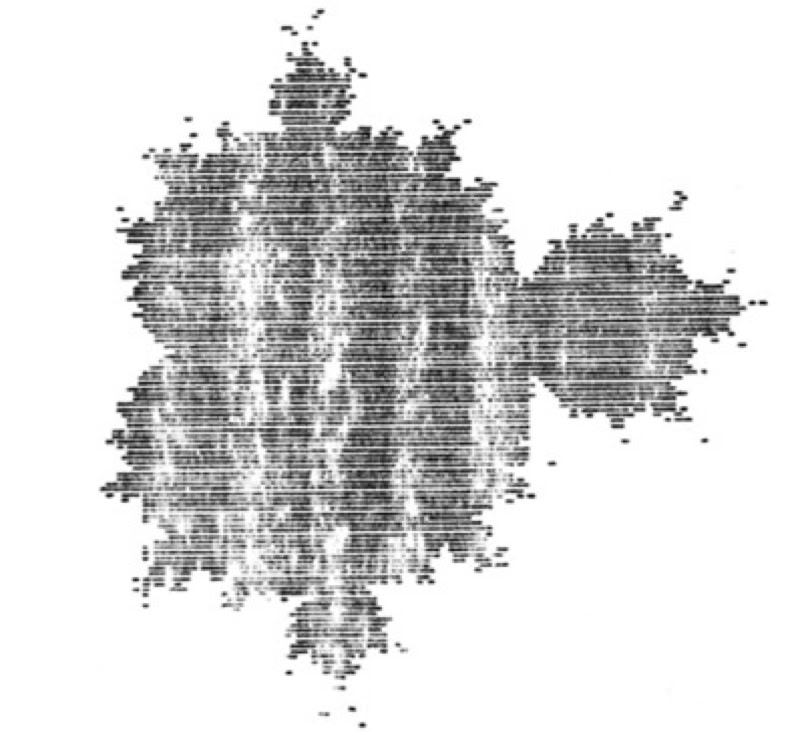
On March 1st, 1980, Mandelbrot first saw a computer representation of the now-famous iterative set. When Mandelbrot published his pictures in 1980 he noted the ‘dust’ surrounding the fractal. Because of this dust, Mandelbrot speculated that the set was discontinuous. The editors of the journal, however, removed the dust from the illustration, assuming it was an artifact of the printer! This dust was a result of tiny intricate islands connected by as-yet invisible filaments that would only be understood years later.
But, for all of this ‘high-powered’ computer work, what credit should be given to Pierre Fatou, the French mathematician, who was the first to propose the set as a result of his work in 1906 on what would become known as Julia sets. Without computers he could not have realized the notion of chaos contained in the simple equation. Later Gaston Julia would do great work on these sets that Mandelbrot would name after him. Mandelbrot studied under Julia in the 1940s.
Mandelbrot was the one to realize what had been discovered. He even claimed to be the one who discovered it. He realized that Julia sets were fractals and that the Mandelbrot set was the general set in which each point represents an individual Julia set. Mandelbrot was certainly the one who wrote about it, coined the term fractal and got James Gleick interested to include it in his best-selling 1987 book “Chaos”, which I thoroughly recommend.
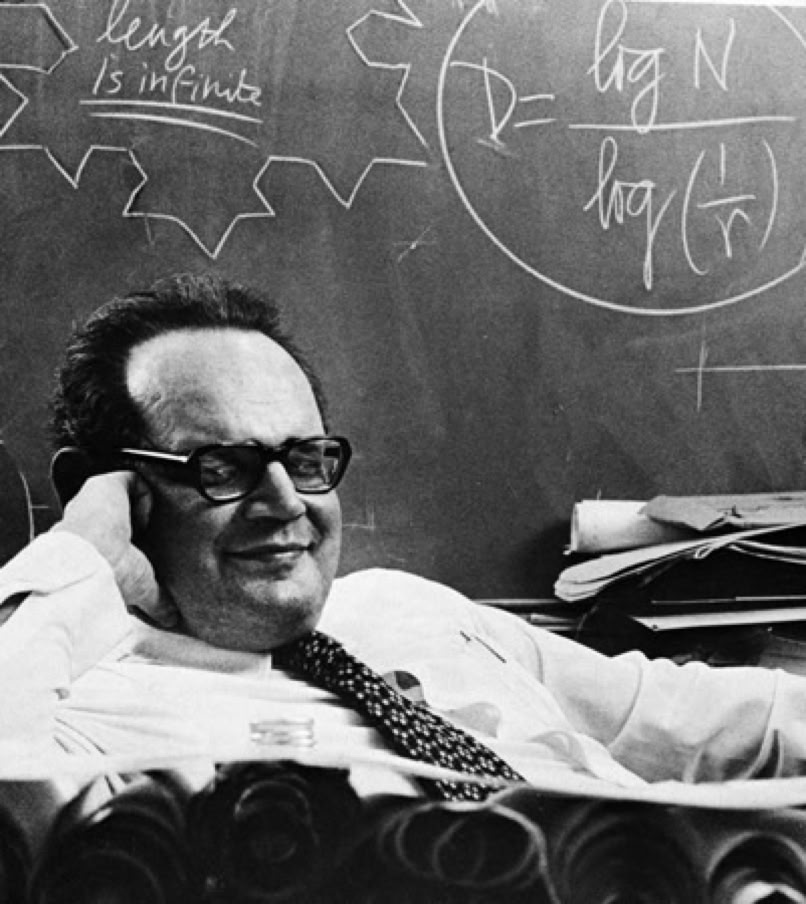
Here is Mandelbrot with the Koch fractal chalked on the board behind him:
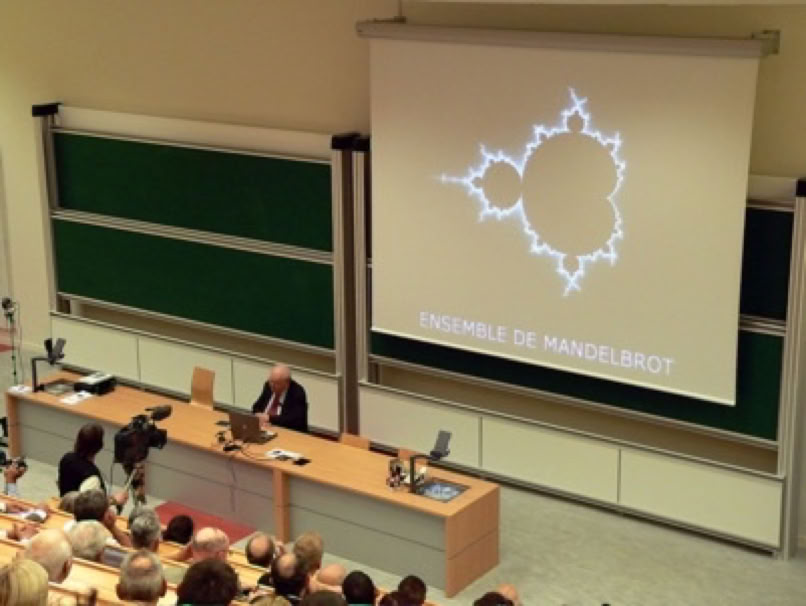
And here he is later in life on the lecture circuit:
However, the fact that Mandelbrot was so ungracious in sharing the credit for the discovery irked the others. While Mandelbrot claimed that no one else understood what they had found, Matelski was quoted as saying (in the Hartford Courant, a newspaper that reported on the dispute in December 1989) “You don't have to fully exploit the mineral resources of a continent to discover it. All you have to do is kneel down and kiss the beach."
So what of this discovery? Why all the fuss? Perhaps because it is the most intricate, complex, fascinating and beautiful object in all of mathematics...

The Koch fractal is a neat way to illustrate a fractal. Start with a triangle. For every line, make the middle third of the line into a triangle. And again for every line. And again. Each time you add length to the outline, but the area will never be bigger than the circle you can draw around that original triangle.
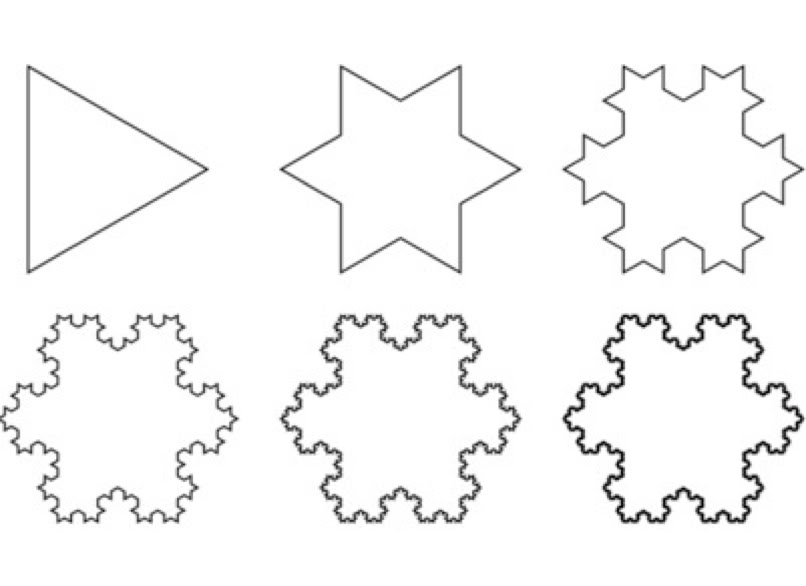
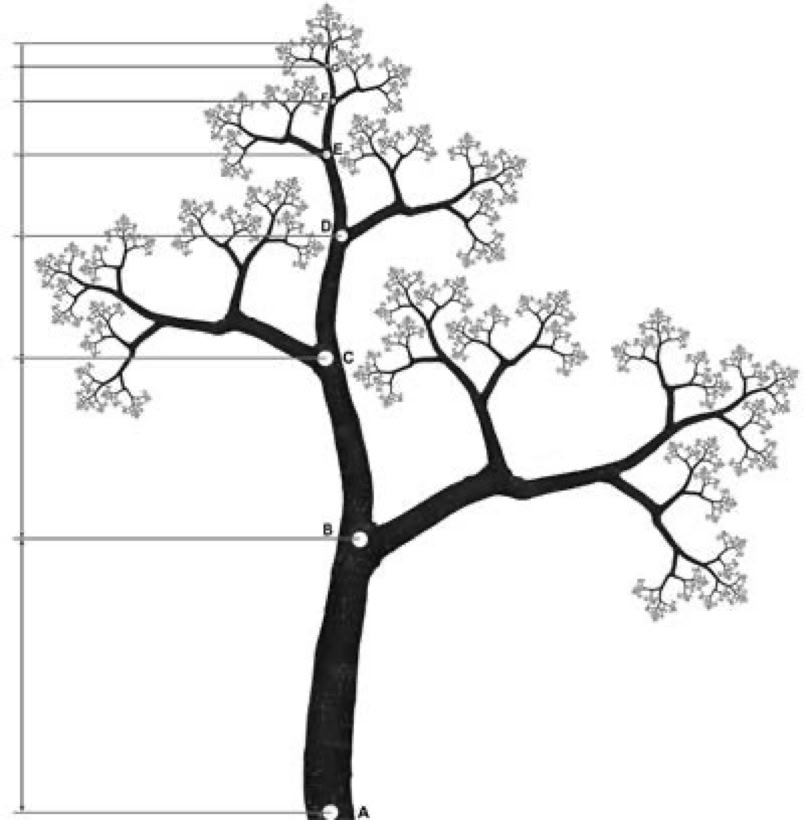
When you’re done (but since it’s infinite, you’d never really be done) you will have created the Koch snowflake. Real snowflakes are an example of fractals in nature, along with things like trees and mountains... the closer you look, the more you see repeating patterns that look like the thing as a whole. Here’s a tree fractal:
The equation for the Mandelbrot set contains c as a complex number. If you start with z=0 and test a value for c, you then take the result as the next value for z. And again, just like for the Koch snowflake. And again. Each time taking the result as the next value for z. If the result tends to infinity it belongs outside the Mandelbrot set. If the result remains bounded and does not tend towards infinity, the point is part of the Mandelbrot set.
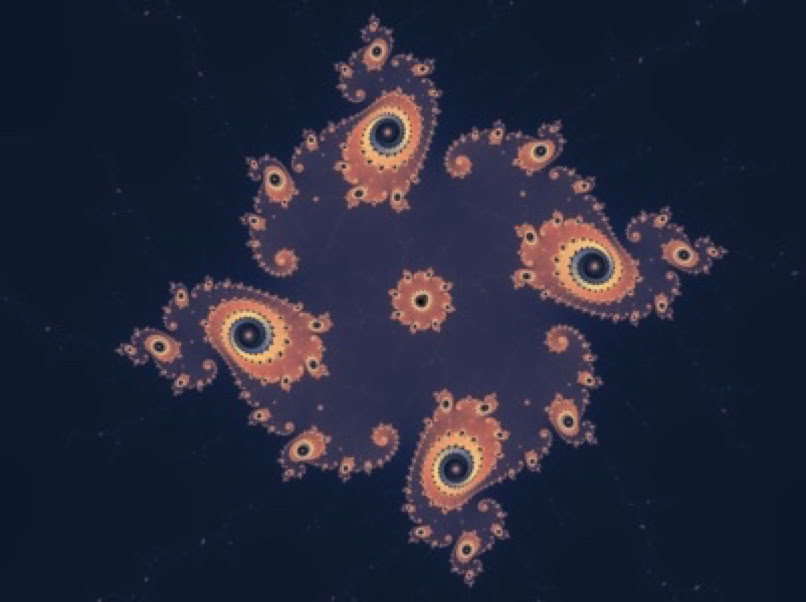
For any point contained within the Mandelbrot set, the corresponding Julia set is an infinitely complex but completely connected.
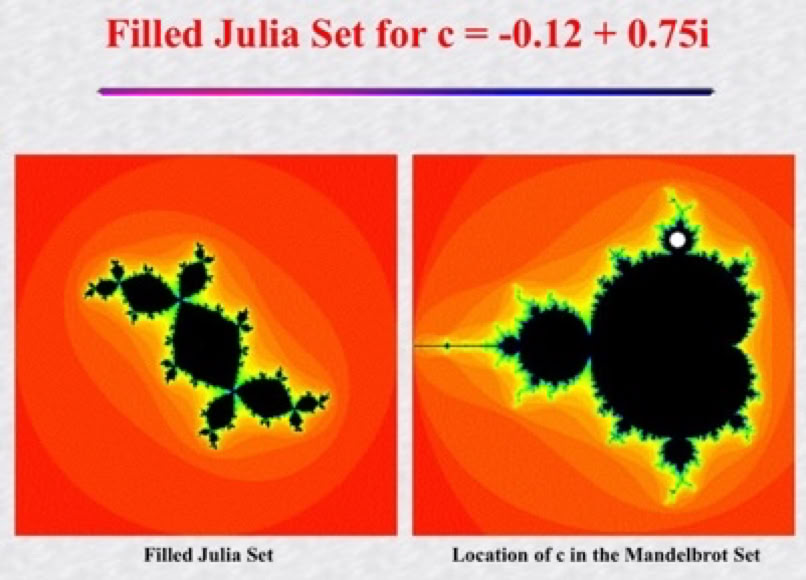
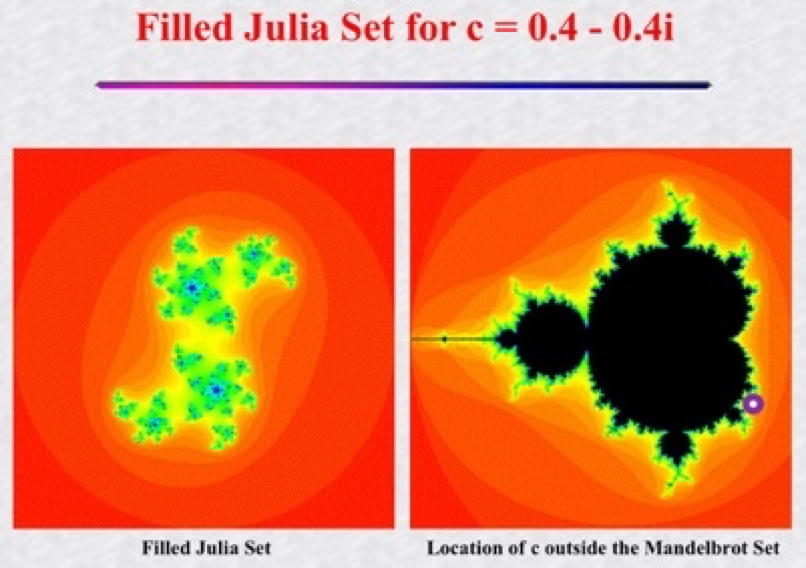
For each point outside the Mandelbrot set, the corresponding Julia set is an infinite array of islands.
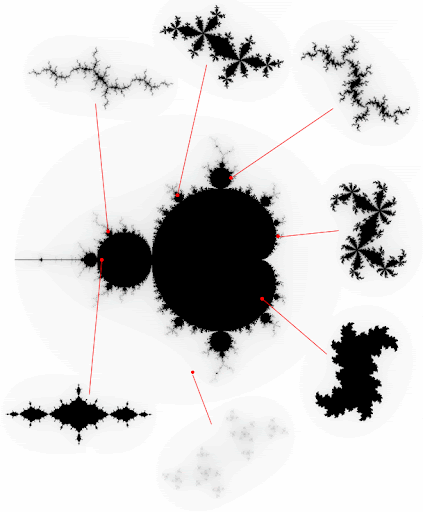

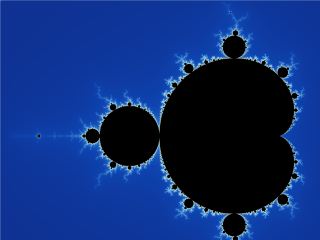
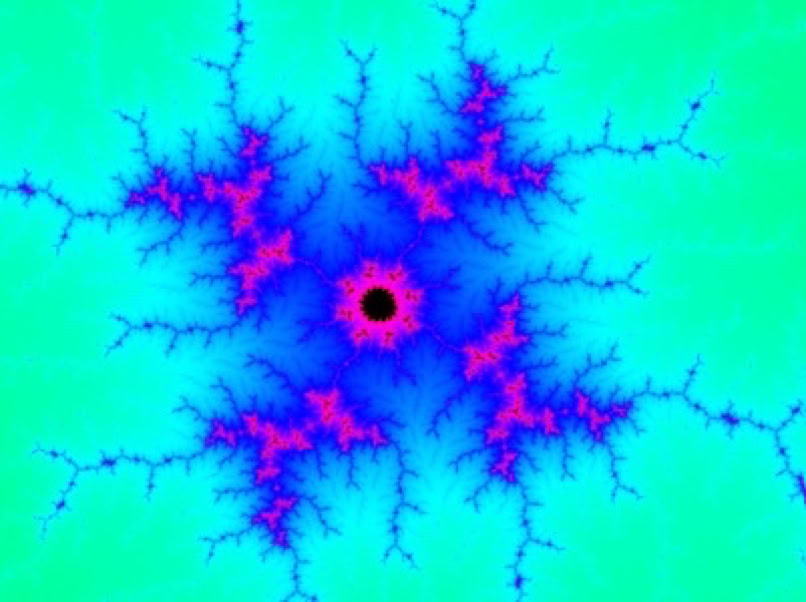
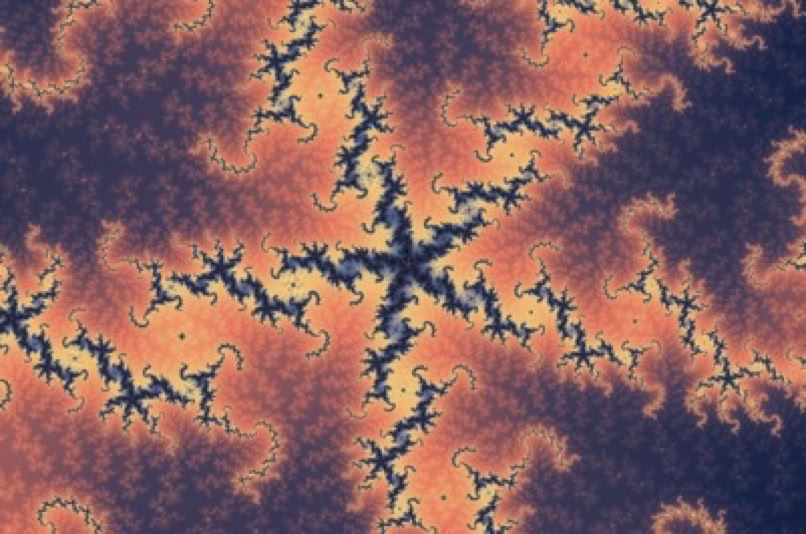
Here’s one of the infinite number of Julia sets at higher resolution...
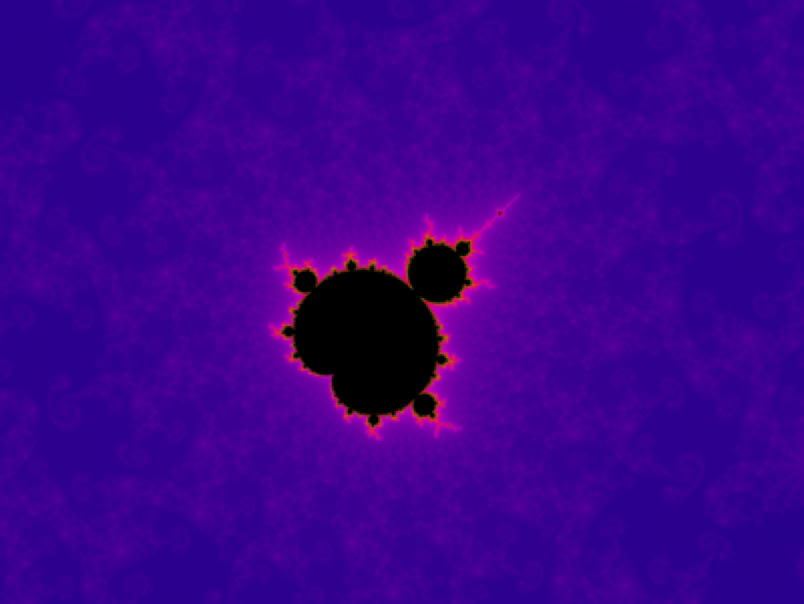
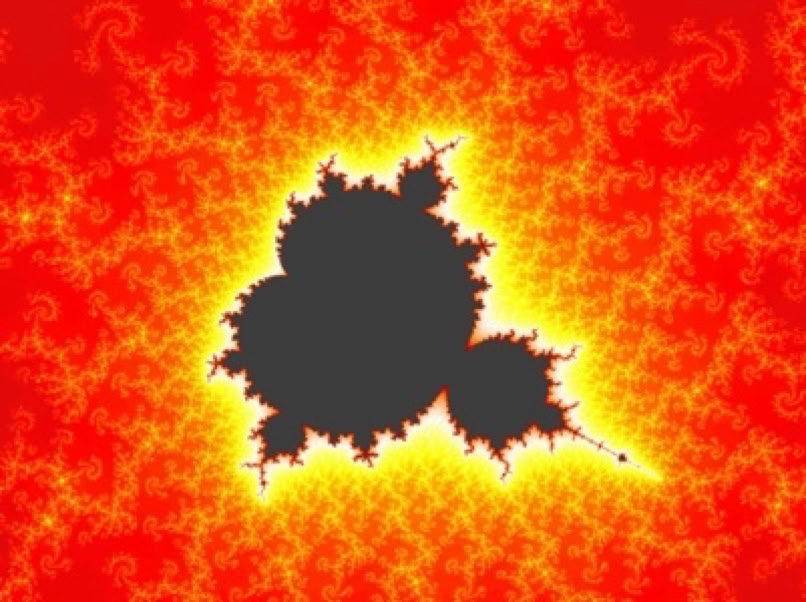
Traditionally a point within the Mandelbrot set is colored black. The points outside the set are colored according to how quickly they tend towards infinity. It’s that boundary at the edge of the set that is so utterly amazing. The tiniest change in the starting condition can dramatically affect the result, and the Mandelbrot fractal has become an illustration and icon for chaos theory.
Hubbard and Douady proved that all the tiny, intricate details, all the tiny islands or particles of dust, are connected. The length of the perimeter of the fractal is infinite, but its area is no bigger than 1.5066 (that’s a bit like saying that pi has an infinite number of digits, but it will never have a value more than 3.1416). The fractal does not extend beyond a circle with a radius of 2 (-2 and +2 on the x or y axes).
Of course, today computers can makes millions of iterations and calculate to so many decimal places for values of c that we can zoom into the Mandelbrot set a billion-fold to view an infinite world of patterns. You can do this on your iPhone... there are apps on the App store; check out Fast Fractal, no math needed!
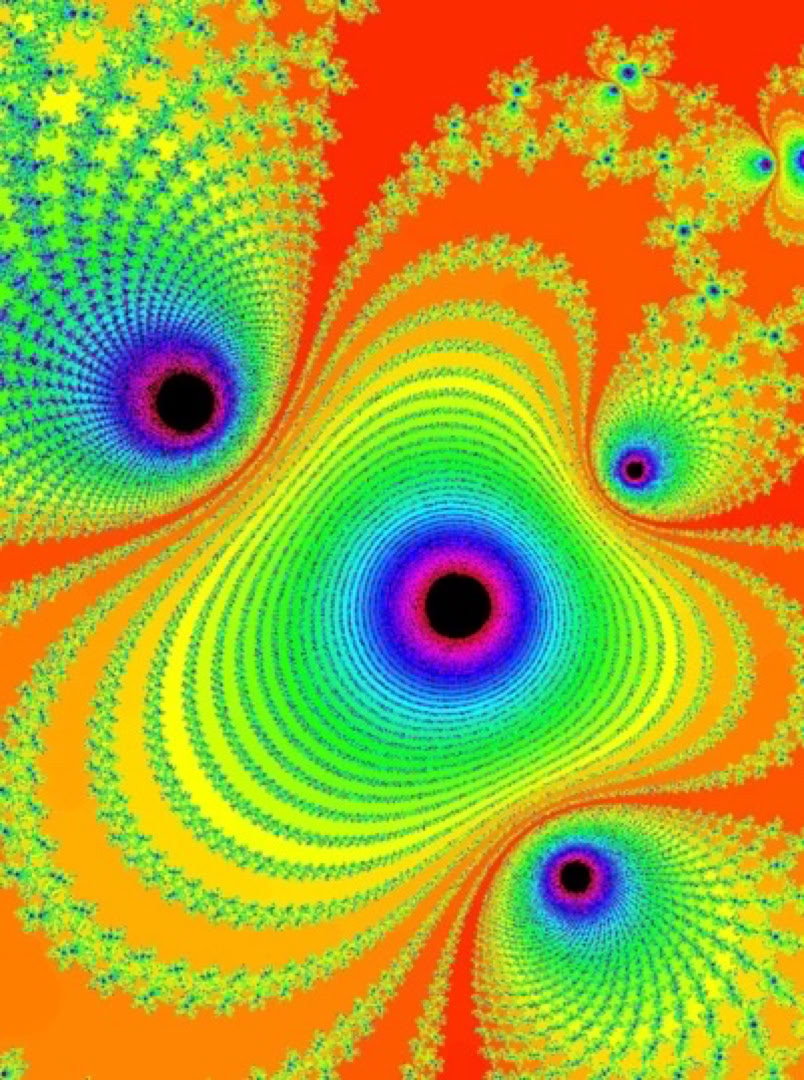
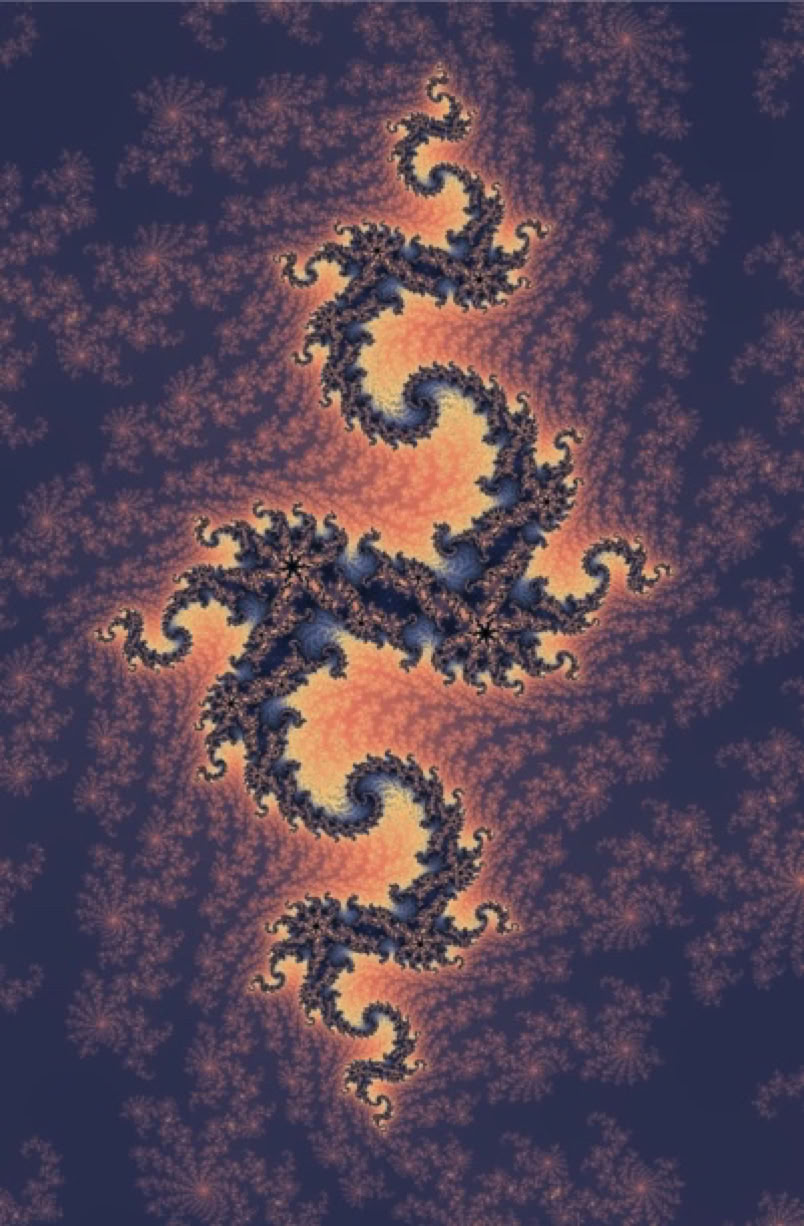
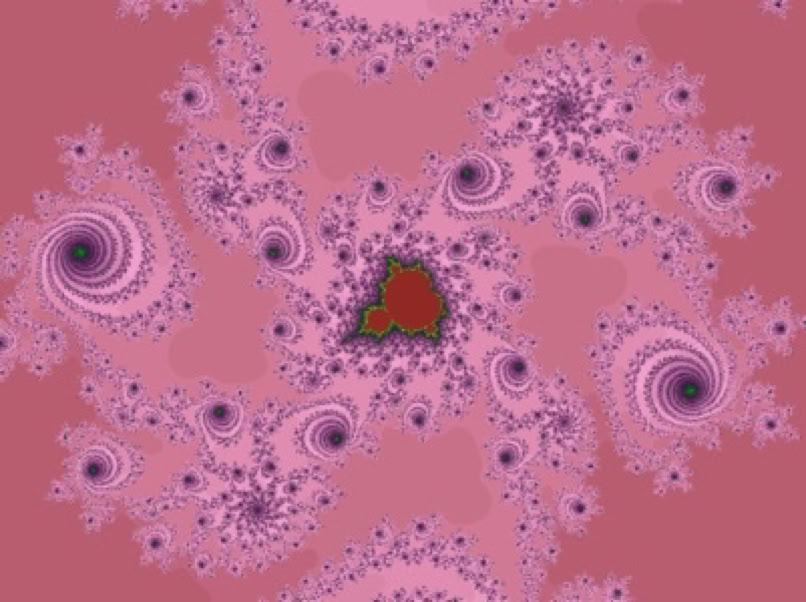
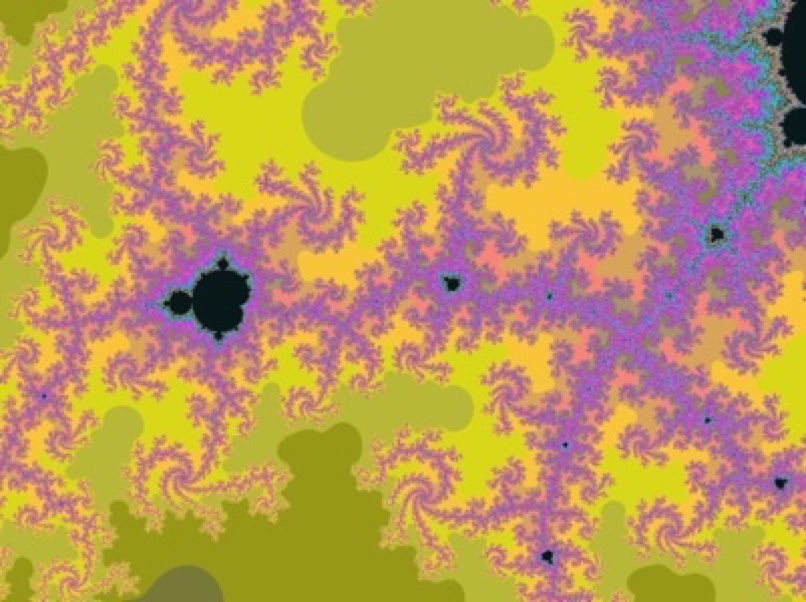
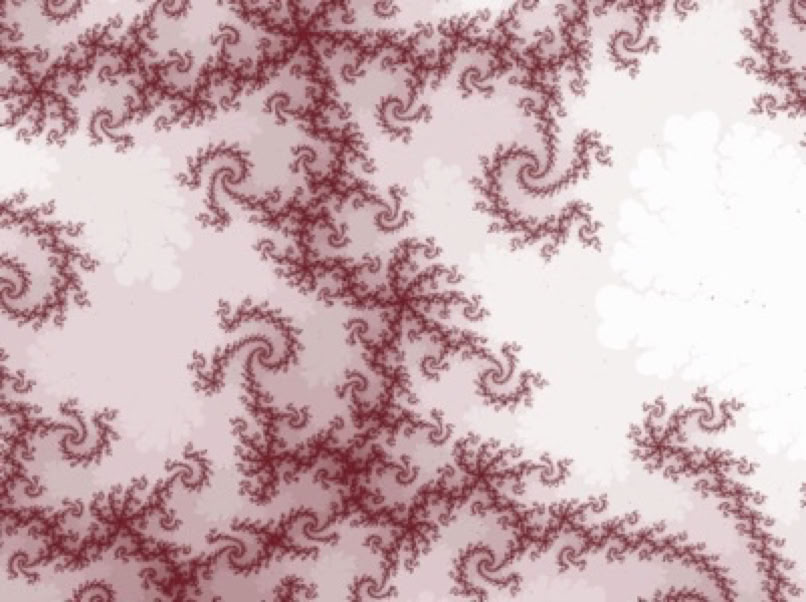
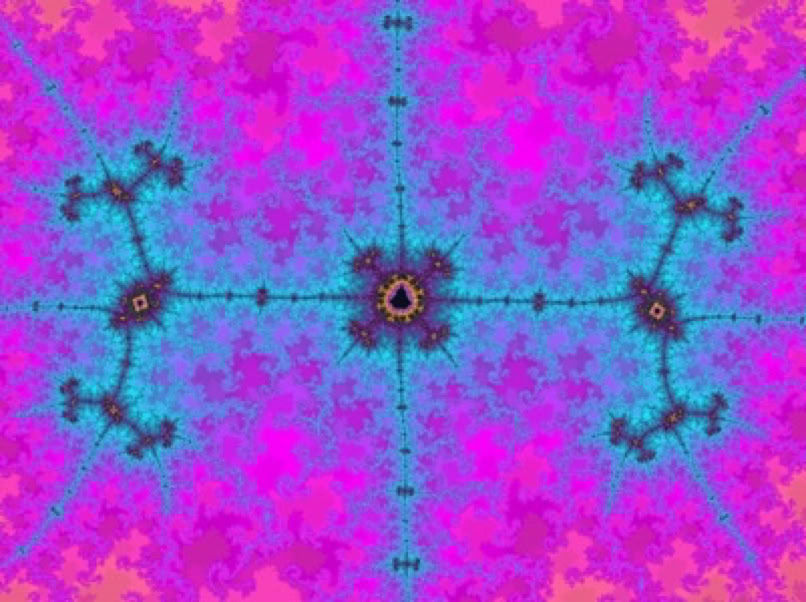
But is it art? These images answer that for me in no uncertain terms!
Mandelbrot zoom from Wikipedia with center at (-0.743643887037158704752191506114774, 0.131825904205311970493132056385139)
and magnification 1 to 3.18×10^31
(10^31 is a LOT... There are roughly 10^24 stars in the whole universe! And about 10^50 atoms in the entire Earth)
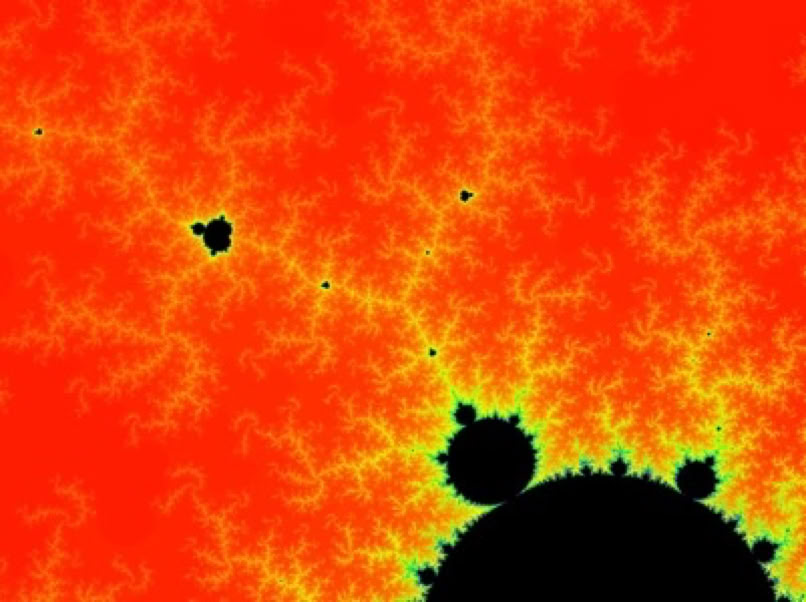
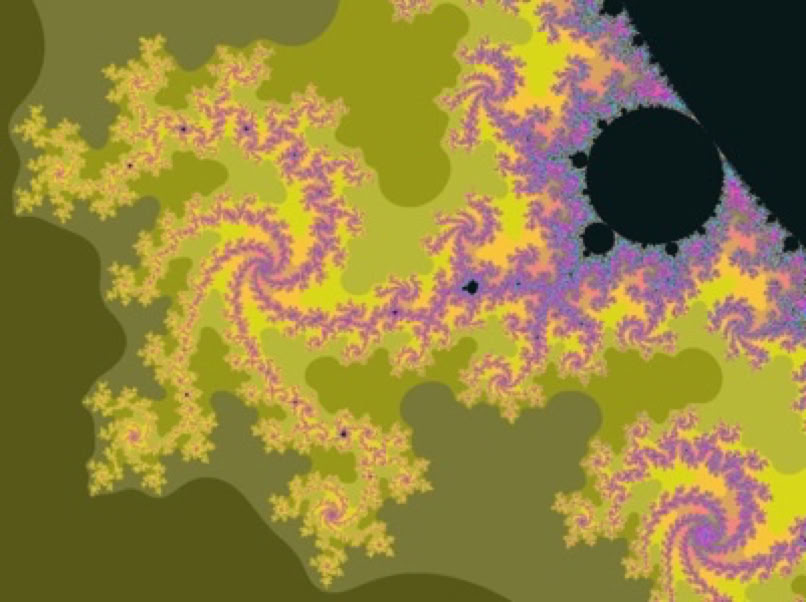
And here are some pictures from inside the Mandelbrot set...


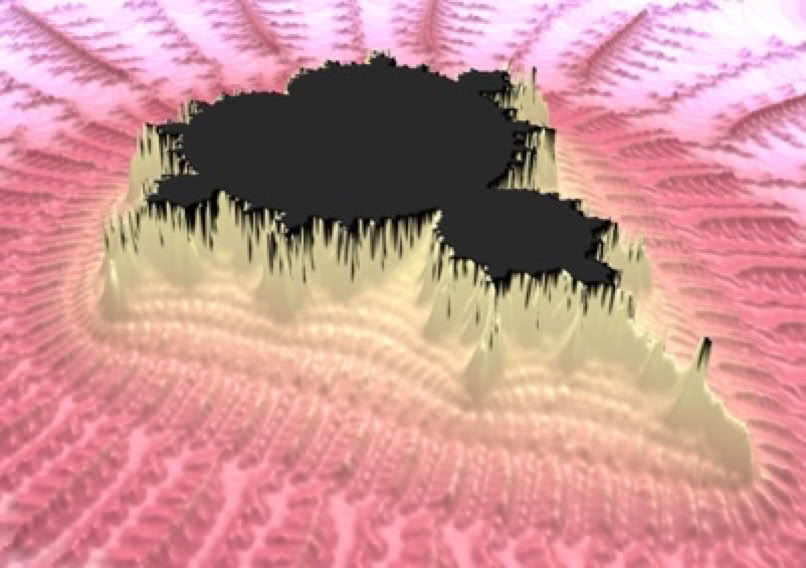
Instead of color... you can use the iterations to define contours and render in 3d: